In industrial environments, bad data doesn’t just cause technical headaches, it clouds decision-making, misguides operators, and puts critical processes at risk. Yet most data quality tools only look at the problem from a tag-by-tag or attribute-by-attribute perspective.
That’s not enough.
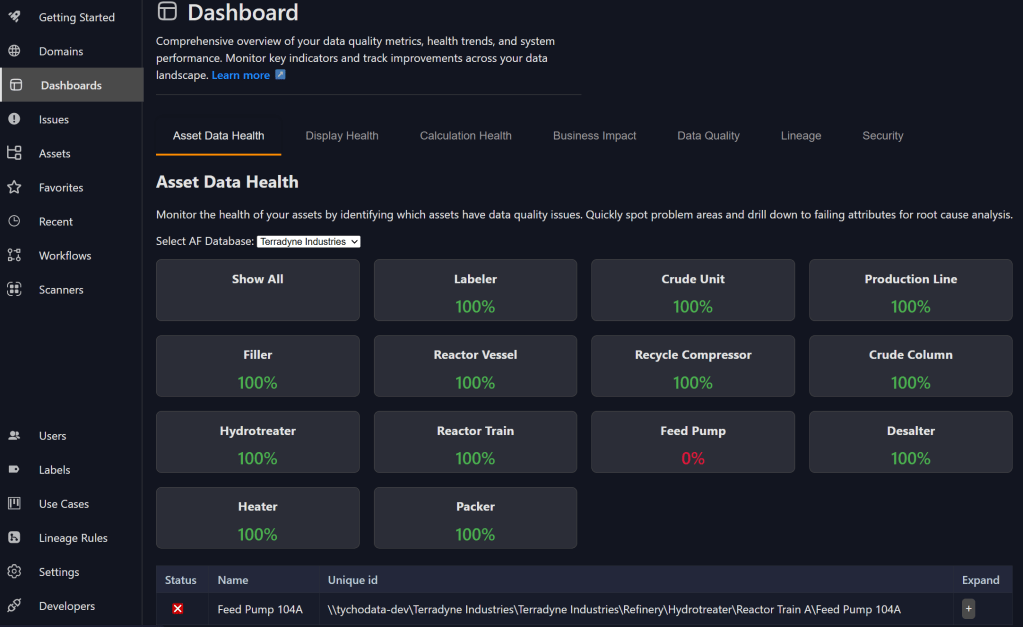
At Tycho Data, we believe that true data observability starts at the asset level because that’s where business context lives. That’s why we built the Asset Data Health Dashboard in Osprey: to give teams a clear, actionable view of which assets have data quality issues and how serious they are.
Why Tag-Based Monitoring Falls Short
Tags and AF attributes are technical constructs. They’re essential, but they don’t tell the whole story:
- A failed tag doesn’t always impact operations.
- A healthy tag might still be irrelevant to production or safety.
- Without asset context, teams can’t prioritize what matters most.
Monitoring thousands of tags individually leads to noise, alerts without context, and troubleshooting efforts that chase the wrong problems.
Enter: Asset Data Health in Osprey
Osprey turns the focus from raw signals to business-critical assets, ie. the pumps, compressors, reactors, and equipment that actually drive production.
Here’s how it works:
- We scan your PI System (AF, Vision, Tags) and group data quality insights by asset.
- For each asset, we detect missing data, flatlines, unexpected gaps, and out-of-bound values.
- Assets with issues are flagged red; healthy ones are marked green.
- You get a ranked view of which assets are at risk and why.
This makes it easy for engineers, managers, and analysts to see where to focus attention without digging through tag lists or guessing which sensors are connected to which processes.
Why Asset-Centric Monitoring Matters
When you shift from tag-based to asset-based monitoring, you gain several advantages:
- Business Relevance: Assets tie directly to safety, quality, throughput, and cost.
- Faster Troubleshooting: Root cause analysis becomes more focused and effective.
- Smart Prioritization: You can triage data issues based on operational risk.
- Better Communication: Engineers and business leaders can speak the same language.
Real-World Example
Let’s say your dashboard shows that “Compressor A” has a data quality issue. You click in and see:
- One of its temperature sensors is flatlining.
- That tag is used in a KPI that feeds a daily production report.
- It’s also referenced in an AF Analysis used for predictive maintenance.
Without Osprey, you might not catch that the flatline is causing KPI deviations or leading your maintenance strategy astray. With Osprey, it’s all surfaced instantly.
Try It Yourself
Want to see what asset-centric data quality looks like?
We’ve built a demo that walks through how Osprey flags critical assets with data issues and highlights what’s affected.
👉 Request a Demo
👉 Learn More at Tycho Data
Closing Thought:
Your data quality strategy should align with how your business operates. Assets are the backbone of your operations and they deserve a first-class view into data health. Osprey helps make that possible.
