If you’ve worked with the PI System long enough, you’ve seen it happen:
good data slowly turns unreliable, systems get sluggish, displays lag, and trust erodes.
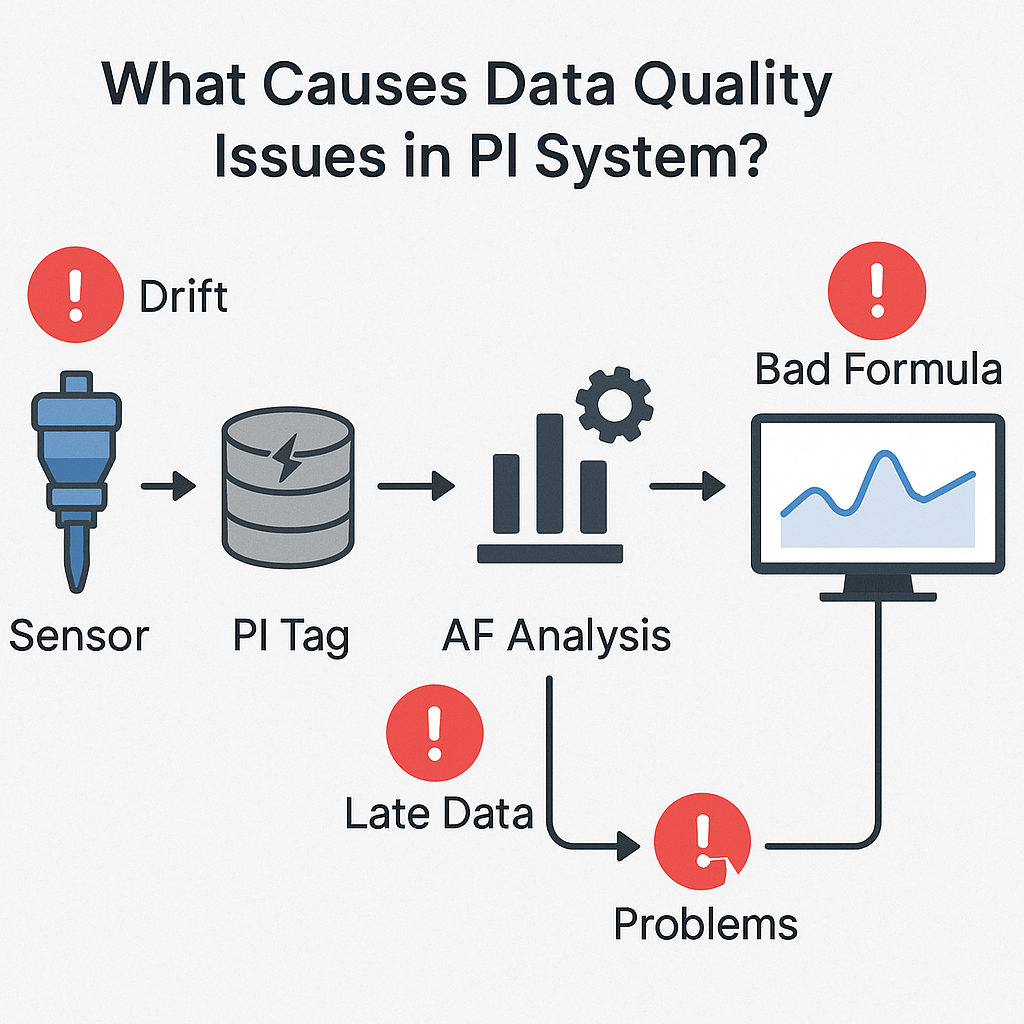
The problem is, data quality issues in the PI System don’t just stay where they start, they cascade.
Let’s break down how this happens, step-by-step, and why it matters more than most people realize.
🔍 It Starts at the PI Tags
At the source, your PI Tags are collecting real-time data from sensors, control systems, and interfaces. But before that data even hits the historian, it’s shaped by two key settings:
-
Exception filtering (what gets sent)
-
Compression filtering (what gets stored)
If your Compression Deviation Percent is set too loose, say, the common default of 2% on a 0-500 unit range, you could easily miss important shifts happening within a 10-unit window.
That might not seem like much… until a critical pressure bump, temperature spike, or level drop goes unrecorded.
Too tight, and you flood the system with high-fidelity data, slowing down performance and overwhelming downstream calculations.
Data fidelity decisions made here affect everything downstream.
📊 Next Stop: PI Asset Framework
Once the data lands in PI AF, things get more complex.
PI AF models are powerful, but they’re also fragile.
-
Mistakes in AF template deployment
-
Incorrect or broken formula references
-
Poorly structured hierarchies
Any of these can compromise the integrity of the AF model.
Analyses running in AF depend on the fidelity and reliability of incoming data.
-
Low-fidelity data = inaccurate calculations
-
Too high-fidelity data = slow calculations, excessive system load, and timeouts
It gets worse with formula-based analyses and on-the-fly calculations, which can drag on PI System performance, impacting not just your calculations but other dependent systems too.
🖥️ Then It Hits PI Vision
By the time this degraded, unstable data reaches PI Vision, it shows up as:
-
Slow-loading, laggy displays
-
Unreliable or stale values
-
Inconsistent trends and calculations
What was supposed to be a trusted operational dashboard becomes something your team has to second-guess.
Operations shouldn’t be sitting there waiting for a display to load or wondering whether that tank really dropped in pressure.
🚨 The Cascading Impact
When data quality breaks down:
-
Operations teams lose trust
-
IT spends hours chasing root causes
-
Performance issues ripple across PI AF, PI Data Archive, and PI Vision
-
Decision-making slows down or gets riskier
And because these issues cascade invisibly, they’re often misunderstood or misdiagnosed.
🦅 How Osprey Can Help
Tycho Data Osprey was built to shine a light on these cascading issues.
With Osprey, you can:
-
Identify AF analyses that are timing out or slowing down performance
-
Track data quality issues back to PI Tags and compression settings
-
Trace lineage across AF Attributes, Analyses, and PI Vision displays
-
Label mission-critical assets with known performance or fidelity risks
It gives operations and data teams the visibility they need to stop performance issues at the source before they ripple through the PI System.
✅ Takeaway
Data quality degradation in the PI System doesn’t stay where it starts.
It spreads.
From tags, to calculations, to asset models, to displays, compromising operational awareness and system performance.
With Tycho Data Osprey, you finally have a tool that can:
-
Catch these issues early
-
Trace their impact
-
Protect the integrity of your operations
Trust your data. Protect your plant.
Ready to See It in Action?
If your team depends on PI System data to keep your plant running safely and efficiently. Osprey is built for you.
