In industrial environments, good decisions depend on good data. And while most data starts its life accurate and trustworthy, by the time it reaches operators, engineers, analysts, or AI models, it can pick up some pretty serious flaws along the way.
If you’ve worked with AVEVA PI System, you’ve probably run into this yourself. Whether it’s a dashboard that suddenly stops making sense, a daily report with inexplicable gaps, or analytics that just feel off, data quality problems in PI are often subtle, cumulative, and surprisingly hard to trace.
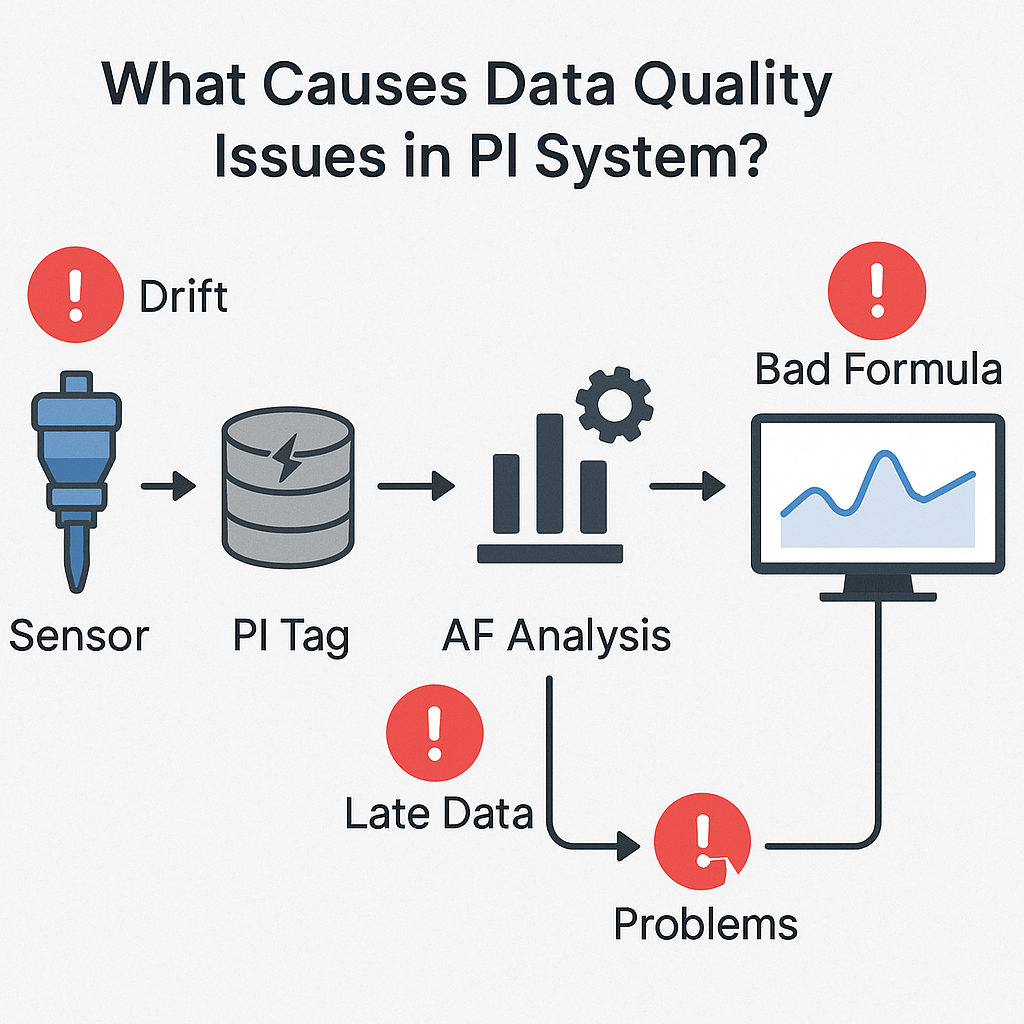
So what causes these data issues?
Let’s break it down.
1️⃣ Bad Inputs: Where Data Quality Issues Begin
It all starts at the source: the instruments, sensors, and devices feeding data into the PI System. If those inputs are wrong, everything built on them inherits those flaws. Common input-level issues include:
-
Sensor failures or drift
Sensors degrade over time or malfunction outright. They may send readings that slowly drift away from reality or spike erratically and unless there’s validation in place, these values enter the system without question. -
Miscalibrations
Even a perfectly working sensor will give bad data if it’s set up incorrectly. Incorrect ranges, wrong units, or missing offsets can silently skew values, only surfacing when something major breaks. -
Tag misassignments
Data sent to the wrong PI Tag is a classic source of silent errors. A flow measurement written to a pressure tag can quietly pollute displays, reports, and calculations until someone notices an impossible number. -
Duplicate tags with different scan rates
This one’s a frequent PI headache. Over time, especially in older systems or after upgrades, it’s common to have multiple tags pointing to the same data source, each with different scan rates, compression settings, or even descriptions.
Some of these are actively used, others are outdated leftovers. The result: analytics, displays, and reports might unknowingly pull from different versions of the “same” data. Small differences in time resolution or data compression turn into conflicting trends, bad averages, and unreliable alerts. -
Network outages or dropped data
Lost connections between devices and the PI Data Archive lead to missing or partial data sets. Gaps like these can skew KPIs, distort time-series analytics, and cause dependent calculations to behave unpredictably.
2️⃣ Problems During Data Handling
Even if your inputs are perfect, data can break as it moves through your PI System. Data is constantly being moved, calculated, aggregated, and reshaped. Here’s where issues creep in:
-
Incorrect calculations or analyses
Bad formulas, incorrect units, or circular references in AF Analyses can propagate errors across your data. -
Sequence errors or late-arriving data
PI relies on time ordering. If data arrives late or out of sequence, you may see duplicate values, gaps, or backwards trends. -
Improper scan rate or compression tuning
Configurations that are too aggressive may filter out important variations, while too relaxed settings can generate overwhelming noise.
3️⃣ Problems People Create
The people working with your PI System, engineers, analysts, developers can unintentionally introduce issues too. Not because they’re careless, but because industrial data environments are complex, and small changes ripple in surprising ways:
-
New templates, elements, or analyses
Adding new AF Templates or modifying existing ones can change the shape of data, altering granularity, scaling, or calculation logic often with unintended downstream effects. -
Bug fixes
Ironically, fixing a problem can create new ones. If downstream systems had already compensated for a bad value or quirk, correcting the source can destabilize everything that relied on it. -
Refactors
Reworking the structure of an AF model, cleaning up hierarchies, renaming attributes, or reorganizing elements, can break links, calculations, and displays if everything depending on those structures isn’t also updated. -
Optimizations
Small changes to make data collection, processing, or reporting faster can sometimes sacrifice quality. Granularity, rounding, or event filters might quietly alter what gets stored or displayed. -
Turnover and documentation gaps
When team members leave, their system knowledge often leaves with them. Incomplete documentation makes it easy for successors to misinterpret tag mappings, calculations, or data flow assumptions, leading to subtle long-term errors.
Why It Matters: Scars and Shocks
The consequences of these data quality issues often show up in two forms:
-
Data Scars
Historical data errors that persist in your archive. These can mislead analysis, skew AI training, and erode trust in reporting. -
Data Shocks
Sudden, sharp changes in data trends caused by errors, fixes, or system changes. Sometimes they reflect real events, but often they’re signals of something broken. Even correcting a problem can cause a shock when the data suddenly “jumps back” to normal.
Final Thoughts
Data quality in PI Systems isn’t a one-time check, it’s a continuous challenge. Errors can originate at the sensor, during processing, or through human actions. Many are silent and cumulative, making it tough to trace problems back to their source.
If you manage a PI System, it’s worth regularly auditing your inputs, tag structures, and AF configurations. Look for duplicate tags, mismatched scan rates, or orphaned elements. Understand how small changes ripple through your data stack, because in the world of industrial operations, bad data isn’t just inconvenient… it’s costly.
Ready to See It in Action?
If your team depends on PI System data to keep your plant running safely and efficiently. Osprey is built for you.
