As industrial businesses collect and rely on more data from their PI System for operations, analytics, and AI, it’s no longer enough to just store and trend the numbers. You need to know if your data is healthy, behaving as expected, and trustworthy. That’s where data observability comes in.
In short:
Data observability means having visibility into the state, reliability, and behavior of your data pipelines, from sensors to PI Data Archive to AF to downstream consumers.
For industrial teams, especially data engineers, AF developers, and support staff, observability is how you stay ahead of problems before they impact production, reporting, or AI models.
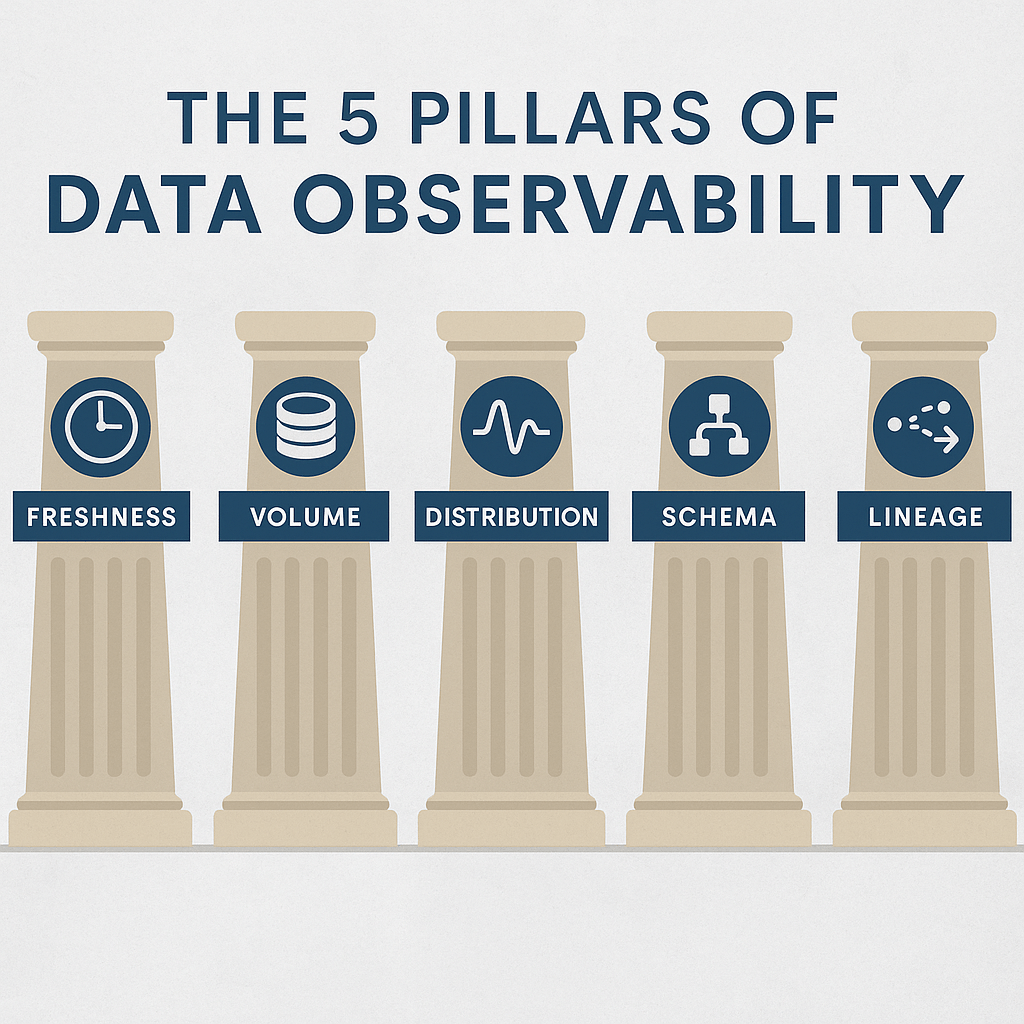
Here are the 5 core pillars of data observability in the PI System context:
1️⃣ Freshness
Is my data arriving on time?
Freshness tracks how up-to-date your data is compared to when it’s expected to arrive. Industrial systems rely on near-real-time data, even small delays can lead to operational blind spots.
Why it matters:
Late data breaks trends, delays alarms, and can derail analytics that require current inputs.
What to look for in PI:
- Tags or interfaces with delayed or missing values.
- AF Analyses or Event Frames generating late.
- Data pipelines between systems introducing lag.
2️⃣ Volume
Is the expected amount of data arriving?
Volume checks whether your data is complete, no missing records, no silent drops. This is crucial when every reading matters, like hourly totals or real-time production rates.
Why it matters:
Missing or partial data corrupts dashboards, reports, and AI models, leading to costly misinformed decisions.
What to watch in PI:
- Sudden drops in record count.
- Tags going flat (no updates).
- Scan rate mismatches or misconfigured tags leading to incomplete trends.
3️⃣ Distribution
Is the data behaving within expected ranges and patterns?
Distribution checks whether the data values you’re getting match historical patterns, expected ranges, or operational norms. It helps detect anomalies that aren’t obvious at a glance.
Why it matters:
Unexpected outliers or shifts could indicate process issues, sensor problems, or misconfigurations.
How it shows up in PI:
- A normally stable temperature tag suddenly fluctuating wildly.
- Production totals far exceeding plant capacity.
- PI tags drifting steadily without corresponding process events.
4️⃣ Schema
Is the data structure consistent?
Schema observability makes sure the shape, format, and metadata of your data hasn’t silently changed. In the PI world, this means verifying that your tag definitions, AF templates, and interfaces are behaving consistently.
Why it matters:
A subtle change in scan rate, engineering units, or tag names can silently break downstream systems, calculations, or reports.
What to monitor in PI:
- Duplicate tags with different scan rates or ranges.
- Tags moved or renamed without updating downstream dependencies.
- Changes in AF template structures impacting event frames or AF Analyses.
5️⃣ Lineage
Where did the data come from, and what happened to it along the way?
Lineage provides traceability, following data from its source (a sensor, calculation, or import) through the PI System into AF and downstream systems. It shows what transformations, calculations, and decisions happened along the way.
Why it matters:
When something looks wrong, you need to know where the issue started and what systems it passed through to quickly diagnose and correct it.
How to track in PI:
- What interfaces and scan classes collected the data.
- What AF calculations or templates processed it.
- Where it’s being consumed — in dashboards, reports, exports, or SQL Server via PI Integrator.
🎯 Why Data Observability Matters for Industrials
If you rely on PI System data for operational decisions, optimization, and AI — you need confidence that the data is healthy and trustworthy at all times.
Observability prevents:
- Unnoticed sensor failures or bad inputs
- Silent data pipeline delays
- Unexpected outliers corrupting reports
- Broken AF models propagating errors downstream
- Bad data sabotaging your AI or analytics results
In short, observability is how you catch problems before they cost you real money.
✅ Final Thoughts
For modern industrial operations, data observability isn’t a nice-to-have, it’s a competitive advantage. With good observability across these 5 pillars, your team gains control, insight, and speed, instead of reacting to problems after it’s too late.
Curious about how to bring observability into your PI System?
Let’s talk. We’re building tools and best practices to make this easier than ever.
