Every display, dashboard, and calculation in your PI System tells a story. But what happens when you realize you don’t know where that story starts?
Industrial teams rely on the PI System to make critical decisions, monitor equipment, and keep operations safe. But as data moves across PI Tags, AF Attributes, analyses, and displays, often evolving over time, one question starts to surface:
Where is this data coming from, and what else depends on it?
If you’ve ever paused before renaming a tag or deleting a legacy server, unsure what might break, you’re not alone. These moments reveal a deeper challenge, one of data source traceability, and a hidden dimension of data quality.
🔍 What You’re Really Trying to Figure Out
Here are some of the most common (and stressful) questions we hear from PI System users:
- “If I delete or rename this PI Tag, what displays, analyses, or systems will break?”
- “Which Vision displays use this AF attribute?”
- “Why is this display pulling data from the wrong server?”
- “What’s feeding this calculation?”
- “Where is this tag used across my AF databases and displays?”
- “Which screens will be affected if I decommission this server?”
- “How can I find all tags mapped to this asset?”
- “I need to clean up legacy configurations. How do I know what’s still in use?”
These questions tend to surface during server migrations, system cleanups, or troubleshooting scenarios and answering them often involves guesswork, manual SQL queries, or time-consuming display reviews.
🧭 It’s Not Just a Data Problem – It’s a Data Quality Problem
When most people think about data quality in the PI System, they think about sensor reliability or bad values. But quality also means:
- Knowing where your data comes from
- Understanding how it flows through your environment
- Having confidence that your dashboards and alerts are connected to the right data
Without source traceability, it’s hard to make changes, clean up legacy systems, or even trust the numbers you’re seeing.
🔗 What You’re Missing: A Map of Connections
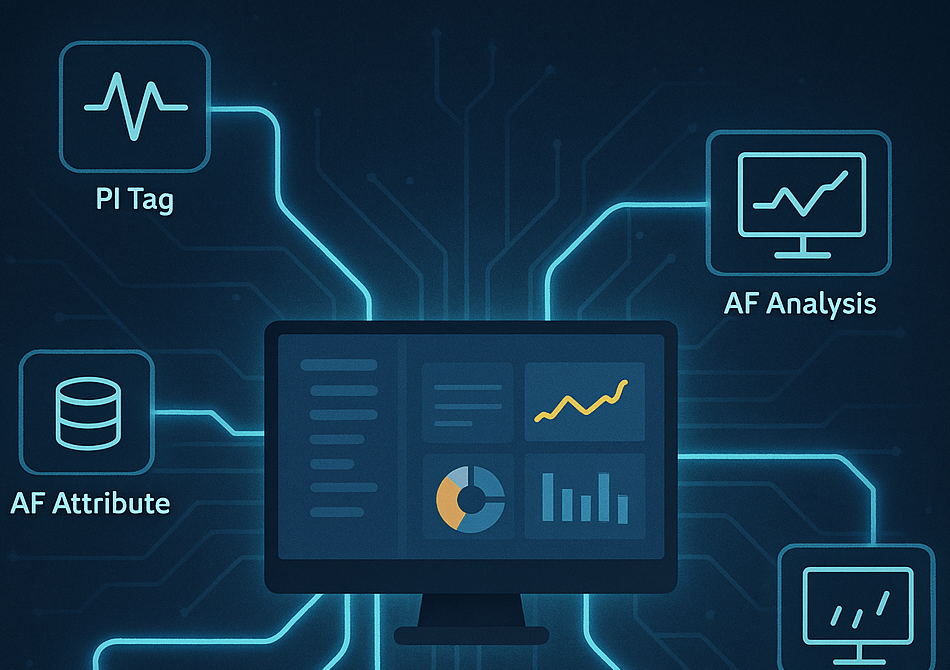
What’s often missing is a clear view into how data sources (PI Tags and AF Attributes) are connected to displays, screens, and analyses.
PI Vision makes it incredibly easy to build displays but without tooling to show what’s behind those screens, teams are left flying blind. Over time, displays proliferate, references get stale, and legacy servers stick around because no one’s sure what will break.
This isn’t just a “lineage” problem though that’s what it’s often called in the data world. In industrial environments, it’s really about dependency awareness, source mapping, and impact analysis.
🛠️ How Tycho Data Osprey Helps
That’s where Tycho Data Osprey comes in.
We’ve built Osprey to give PI System users a clearer view of their data connections specifically answering questions like:
- Which PI Tags and AF Attributes are mapped to which PI Vision displays?
- What server and database are those AF references coming from?
- If I change or remove a tag, what screens will be affected?
- What assets or templates are driving this attribute?
- Where is this tag used across all displays and AF configurations?
It’s like turning the lights on in a cluttered attic suddenly, you can see what’s connected, what’s still being used, and what’s safe to clean up.
✅ Real-World Benefits
With Osprey’s data source mapping capabilities, you can:
- Proactively avoid broken dashboards and calculations
- Accelerate server and database migrations
- Build trust in your PI Vision displays
- Give operators and engineers confidence that the numbers they’re seeing are valid
- Decommission legacy infrastructure with certainty
- Audit existing configurations to clean up what’s no longer needed
💡 The Bottom Line
Your data quality story starts long before a number shows up in a dashboard. It starts with where that number comes from and the invisible web of connections that feed it.
Tycho Data Osprey helps you see that web clearly, so you can make confident changes, keep your systems clean, and trust the data that powers your operations.
If you’ve ever asked, “Where is this data coming from?”, Osprey has the answer.
Ready to See It in Action?
If your team depends on PI System data to keep your plant running safely and efficiently, Osprey is built for you.
